One World, Our World

School program teaching leadership, tolerance and peace - best for grades 4-7. Students reduce bullying by their own peer pressure behaviors. Long term builds quality leadership in the community.

  • RSS
  • Home
  • Overview
    • Testimonials
    • Train the Trainer Details
    • Videos
      • Unit 1 – Start the Game
      • Unit 2 – Observations & game rule expansion
      • Unit 3 – Population Density, Food and Energy Disparity Simulation
      • Unit 4 – Simulation Conclusions, Ways Forward, More Soon in Class
      • Unit 5 – Friends
      • Unit 6 – Listening Skills
      • Unit 7 – Leadership
  • Suggestions / Follow-up
  • About
    • History – Peace Corps – computer – tours – video
  • Contact
  • Conflict Resolution
  • Climate Change Updates
  • Energy Sourcing
You are here: Home / Blog / Climate Sensitivity to CO2

Climate Sensitivity to CO2

September 12, 2020 by Rudy Sovinee Leave a Comment


Climate Sensitivity to CO2  … determines the degree of warming Planet Earth incurs as the atmospheric concentration of CO2 rises. People and especially governmental policy makers need to understand the consequences that will occur due to past and future emissions. The images of fires and smoke along the USA’s West Coast now repeat yearly, with new extremes often breaking old records for heat and fire. Studies are mounting and one headline reads: Earth Is Barreling Toward a ‘Hothouse’ State Not Seen in 50 Million Years The image depicts the situation and suggests abrupt changes in global climate can follow relatively small changes in atmospheric CO2 concentration. This suggestion is not one that is politically acceptable because of its dire consequences. The truth hinges on the topic of this post.

Study fine tunes climate history
This Sept 2020 study indicates the current pace of anthropogenic global warming far exceeds the natural climate fluctuations seen at any other point in the Cenozoic era, and has the potential to hyper-drive our planet out of a long icehouse phase into a searing hothouse state.

Climate Sensitivity

This is a technical post on the topic of Climate Sensitivity. A team of scientists believe they have narrowed the range of potential values from “the previously accepted range of 1.5 to 4.5ºC first established in 1979 (roughly 3 to 9ºF), to a narrower range of 2.6 to 3.9ºC.” NASA Blog: Making Sense of Climate Sensitivity  In their discussion of climate sensitivity, the authors settled on a 150 years as the time frame for the faster consequences to be measurably complete. I note that they appear to have ignored the exponential amplification of effects that I posted about in discussing methane and other amplifications. Still, it is an excellent article for presenting the topic well in broad strokes.

How bad can it be?
The range of projections as to global warming likely based upon variations of response to the IPCC report of 2007 as annotated to show consequences on one chart. If this century is bad, the trends into the 22nd Century are worse.

The Politics

Humanity, and more imminently human society, is raising the level of greenhouse gases, primarily of CO2. The higher the climate sensitivity to CO2, the more temperatures will rise as CO2 increases. Look to the image at the right. We already saw in earlier IPCC reports what to expect from various increases in the global average temperature. After many subjective choices made in the setting of parameters considered this statement at the top of the NASA article (IMO) underscores the primary result that they politically needed to arrive at: “Essentially, by narrowing the range of estimates, the researchers found that climate sensitivity isn’t so low that it should be ignored, but it’s also not so high that there is no hope for the planet’s recovery.”

Temperature impact of CO2 takes time to be completed
Reaching equilibrium between solar energy absorption and heat radiance takes time.

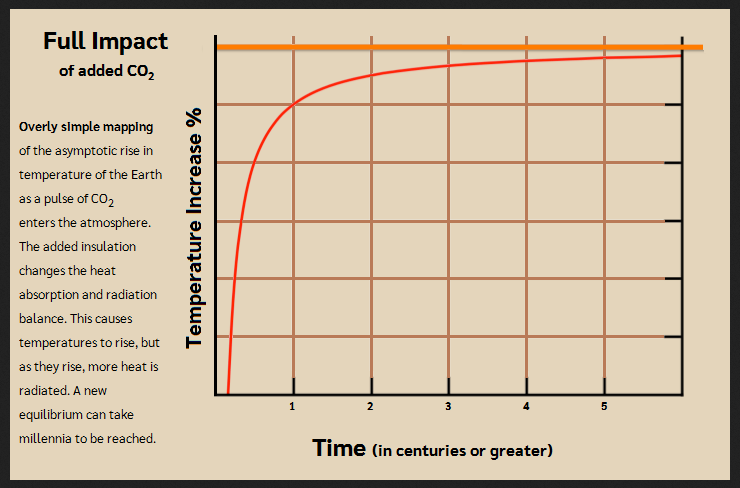
I’ve long considered the IPCC level discussions as striving to generate concern without despair. Ongoing emissions demonstrate the IPCC has not raised concerns enough to get human society to change. Despair not caused by warnings is instead arriving in the experiences of burnt homes, of shrinking islands, lost crops and of softened land that is no longer permafrost. Full equilibrium for any given change in CO2 concentration takes centuries to millennia to be reached, but much of it is done within far shorter time frames. Calculating the effect to expect is made harder because humans continue adding more insulating greenhouse gases, adding to their concentrations in the atmosphere. Despite decades of past international warnings, net CO2 in the atmosphere continues to increase.

Looking more deeply

Debate over climate sensitivity is about how much the temperature will shift. The IPCC was tasked with the magnitude of the shift this century, which requires identifying and tracking all the factors that shift most quickly. Different research teams and then the IPCC came up with different values, based upon their selection of factors that shift, their accuracy of tracking them and the quality of the algorithms in their models.

Whole Earth Sensitivity vs modeled Climate Sensitivities
The long term Whole Earth Sensitivity by David Wasdell vs the smaller Climate Sensitivity shifts in temperature as modeled by a few noted teams.

Separately, we know the ultimate shift will be larger, taking millennia for the planet’s equilibrium to be restored. Dr David Wasdell proposed a way of determining that upper limit by looking at the paleoclimate record. His analysis of the empirical geological relationship between CO2 and temperature when given time to reach equilibrium is summarized in this next graph: “Whole Earth Sensitivity.” In his paper Dr. Wasdell then includes examples of major modeling results from the 1979 Charney Report up to the modeling by Dr James Hansen. Those two open source papers plus this expanded warning by James Hansen as to sea levels give non-researchers a peek into the complexity of variables embedded in the summary statements as to what values each assign to climate sensitivity.

Scientists now agree that the hardest variable to track and model is cloud feedback. The latitude, altitude and density of clouds (condensed water vapor) is extremely transient data to measure and compute into models. See below for reference links to more papers on clouds and climate sensitivity.

Details of the Latest Study

I did not see the time frame defined in NASA’s posted article, but when I followed the article to this PDF “An assessment of Earth’s climate sensitivity using multiple lines of evidence” I saw the team chose to use 150 years. There is this acknowledgement:

“Bringing all the evidence to bear in a consistent way requires using a specific measure of ECS, so that all lines of evidence are linked to the same underlying quantity. We denote this quantity S (see section2.1). The implications for S of the three strands of evidence are examined separately in sections 3-5, and anticipated dependencies between them are discussed in section 6.”
In Section 2.1 they define the time frame as 150 years, adding a reason:
“Our reference scenario does not formally exclude any feedback process, but the 150-year time frame minimizes slow feedbacks (especially ice sheet changes).”
Then later they write:
“the effective sensitivity S that we will use—a linear approximation to the equilibrium warming based on the first 150 years after an abrupt CO2 quadrupling—is a practical option for measuring sensitivity, based on climate system behavior over the most relevant time frame while still approximating the traditional ECS. Moreover, the quantitative difference between this and the traditional equilibrium measure based on a CO2 doubling (with fixed ice sheets) appears to be small, albeit uncertain. This uncertainty is skewed, in the sense that long-term ECS could be substantially higher than S but is very unlikely to be substantially lower. Further work is needed to better understand and constrain this uncertainty.”
The paper’s Section 8 states the following conclusion:
“IPCC AR5 concluded that climate sensitivity is likely (≥ 66% probability) in the range 1.5-4.5 K [ºC]. The probability of S being in this range is 93% in our Baseline calculation, and is no less than 82% in all other “plausible” calculations considered as indicators of reasonable structural uncertainty (seesection7.3). Although consistent with IPCC’s “likely” statement, this indicates considerably more confidence than the minimum implied by the statement. We also find asymmetric probabilities outside this range, with negligible probability below 1.5 K [ºC] but up to an 18% chance of being above 4.5 K [ºC] (7% in the Baseline calculation).”

Why this is Alarming

While politicians say we want to avoid warming the planet by more than 2ºC, our societal actions are still on a path predicted to warm the planet by an average of 3.2 to 5.4ºC (the first degree of which is now history.)
Earth's Temperature History vs Now
Most of Earth’s climate history has been as a Hothouse Earth. Current levels of greenhouse gases already exceed anything in the last 3 million years. Can human society remove the excess greenhouse gases while there is still sufficient ice to save the biosphere that current plants and animals have evolved to thrive in? If not we will return to temperatures of the Eocene, and then to hothouse conditions of 50 million years ago.

Are Humans Responding?

CumulativeCO2 since 2005
Fig. 1 Total cumulative CO2 emissions since 2005 through 2020, 2030, and 2050. Data sources: Historical data from Global Carbon Project (6); emissions consistent with RCPs are from RCP Database Version 2.0.5 (https://tntcat.iiasa.ac.at/RcpDb/); “business as usual” and “business as intended” are from IEA Current Policies and Stated Policies scenarios, respectively (9). IEA data (fossil fuel from energy use only) was combined with future land use and industrial emissions to estimate total CO2 emissions. Future land use emissions estimated from linear trend fit to 2005 to 2019 Global Carbon Project land use emissions data (6). Industrial emissions estimated as 10% of total emissions. Final IEA data use historical values through 2020 and scenario values thereafter. Biotic feedbacks are not included in any IEA-based estimate. Note that RCP forcing levels are intended to represent the sum of biotic feedbacks and human emissions.

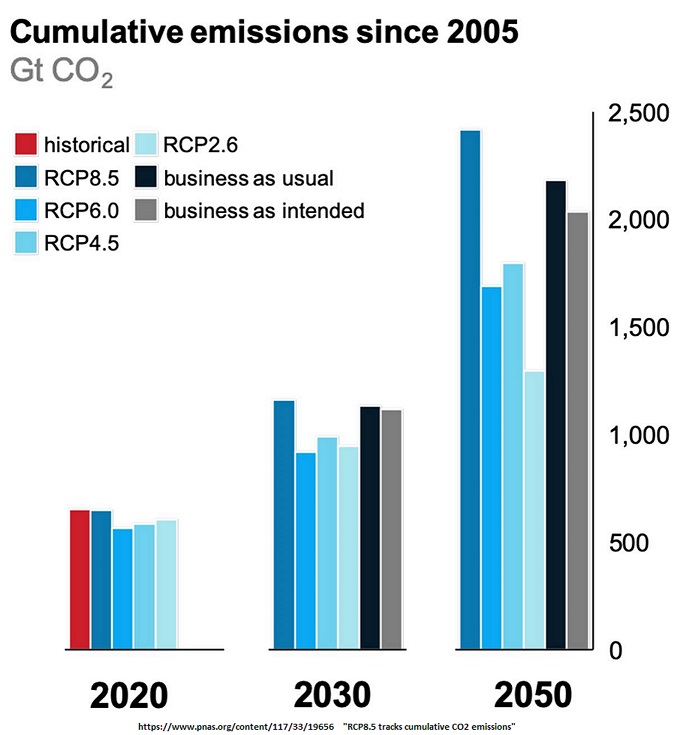
An April 17, 2020 PNAS Report considers arguments that humans are surely not going to stay on the path of emissions indicated by RCP8.5. The key analysis (image to the right) shows that cumulative emissions since 2005 have most closely tracked against RCP8.5.  It highlights that while human emissions might be less than that IPCC scenario, the net emissions between 2005 and 2020 are within 1% of that the cataclysmic path. Continuation on this path suggests a 3.3 to 5.4ºC increase in Earth’s temperature. The report points out that feedback effects such as thawing permafrost, and burning of forests are already sufficient to match the emission reductions humans have managed. These are positive (amplifying) feedback loops that humans need get ahead of and reverse – if there is to be any opportunity to restore Holocene like climate conditions.


The Holocene has ended. Earth is tipping into a Hothouse state
The Holocene has ended. Full circle with the study and image at the top of this post. The Anthropocene is on a path to tip Earth back to a Hothouse state.


References for further reading

  • Why clouds are the missing piece in the climate change puzzle
  • Global warming may be twice what climate models predict
  • Short-term tests validate long-term estimates of climate change

Filed Under: Blog, Climate Change Updates, Conflict Triggers Tagged With: arctic, climate change, climate model, climate sensitivity, CO2, IPCC

Leave a Reply Cancel reply

Your email address will not be published. Required fields are marked *

Our Planetary Energy Surplus this Millennium


90% of the accumulated heat is stored in the oceans, raising the humidity, powering stronger hurricanes and typhoons, making more torrential the rains that happen as well as warmth intensifying the dryness where rains are not occurring. We see it as "Extreme Weather."

Stability is Step #1, Can we remove CO2 before consequences lock in?

Atmospheric CO2
Earth has gained 80ppm in 50 years. EVERY increase means the insulation blanket of our atmosphere has increased. The energy of the sun will warm us more quickly, and the eventual equilibrium temperature will be higher.

Recent years have seen a leveling off of human emissions, but the growth in CO2 concentrations is accelerating. How? Why? Evidence points to planetary amplification of what humans have started. Humans need to reverse course before these amplifications gain momentum and take away any chance of maintaining an inhabitable planet.

Climate Change Updates:

Scientific evidence mounts that human society is pushing the planet into conditions not experienced since before we were anatomically "humans." Posts introducing the unfolding science, explaining what is causing Earth to warm, Climate Change and the consequences of Human Conflict are added here as updates to the initial statements I offered directly related to the school program. My full-throated concerns are shared among my Facebook posts
Title and author over an image of a tree

Wild Free and Happy

I don’t post often, at least not recently. This post is both an update on the mounting climate … [Read More...]

JetstreamInTheAnthropocene

Do Look Up!

DO LOOK UP! Why does it so often get so cold if there is Global Warming? The movie “Don’t Look Up” … [Read More...]

Tipping into a Hothouse Earth

Climate Sensitivity to CO2

Climate Sensitivity to CO2  ... determines the degree of warming Planet Earth incurs as the … [Read More...]

Global Methane Budget

Methane amplifies global warming

For all the talk, studies, reports, climate conferences, and marketing of Green Energy, human … [Read More...]

Social Media Discussion : “Humanity’s Perfect Storm”

Issues of Global Concern: Climate, Energy and Population
Discussions past and current among my Facebook network of friends
Citizen Diplomacy Tour to China 1986

Overview

This is the legacy website of school content once widely presented. If you want the school program content, I suggest you download it. The concepts work, but climate destabilization has me, the founder, now … read on...

ChinaPlay

Train the Trainer Details

This is the main area for anyone looking to utilize this programs content to improve the peer to peer friendships, reduce bullying, and develop better leaders among your school's (district's) students. When it was "on … read on...

VideoScreenCapture

Videos

NOTE: Look to the bottom of this page for a new version of Assembly video 3 of 9. It keeps the sound track of what had been presented hundreds of times in the 1990s and early 2000s, while animating the images. To fully … read on...

History – Peace Corps – computer – tours – video

You are looking at the legacy of a true non-profit organization - now available for FREE anywhere that a caring educator puts their heart and soul into mastering and presenting this content. In 2007 I, the founder, needed to retire - unexpectedly. The 501c3 board members at that time each also soon … read on...

Copyright © 2025 · One World, Our World · All rights reserved.

This is a carbon-neutral site created and operating with 100% clean, renewable energy.

Site design by GreenDreamWeb.

Return to top of page.